Introduction
Website performance metrics show you what’s working and what’s not. They highlight slow pages, flag drop-off points, and pinpoint where visitors leave—so you can fix issues fast and keep more people engaged.
When you know what’s wrong, it’s easier to fix it. Tools that track website performance metrics can help you identify areas for improvement. They allow you to boost speed and increase engagement. Let’s examine how website KPIs help you establish the right goals.
Use Website KPIs to Set Meaningful Performance Goals
KPIs are the key metrics that show how your site is performing. They help you track progress and assess your site’s goals. Every business has different goals, so your KPIs should match what you want to achieve.
Some common website KPIs are bounce rate, time on page, and click-through rate. These numbers indicate whether people like what they see or leave too soon. If your bounce rate is high, you may need to improve your site content or speed.
Utilize website performance metrics and KPIs in conjunction. They provide a comprehensive view of the website’s performance. When you track both, you know if your content works and if people are staying on your site.
Good user engagement metrics mean people are clicking, reading, and exploring. These are signs your site is working well. Now, let’s see how conversion funnel analysis helps you track what users do next.
Apply Conversion Funnel Analysis to Track User Movement
Conversion funnel analysis helps you understand the way people move through your site. It shows where they stop and leave before taking the desired action. This makes it easier to see what needs fixing.
Start by checking each step—from when users land on your site to when they sign up or make a purchase. Google Analytics can help. If many users abandon carts at checkout, that step may be confusing or time-consuming for them.
Combine this data with your website performance metrics. If the Time to Interactive is too long, users may lose patience and leave before acting. A faster site encourages engagement and drives better results.
By analyzing website performance metrics, you can identify what works and what doesn’t. From there, you can work on the weak spots and provide users with a smoother path forward. Now, let’s shift to lead generation metrics and see if your visitors are actually becoming leads.
Monitor Lead Generation Metrics to Gauge Marketing Success
Lead generation metrics indicate how effectively your website attracts new contacts. These metrics include average session duration, sign-up forms, email list opt-ins, and contact page visits. They tell you if your site is helping your business grow.
Utilize simple tools to track the origin of your leads. For example, HubSpot can track which blog posts or ads generate the most leads. You’ll see if people find your content valuable and want to know more.
These metrics are best combined with website performance metrics. If your pages load slowly, fewer people will wait to fill out your forms. A fast site enables users to take action immediately.
Good website performance metrics help you improve your marketing plan. If one page pulls more leads, study it. Apply the same fixes elsewhere. Now, dig into speed and design. They shift key metrics and alter the overall user experience of the entire site.
Align Key Metrics with Page Speed and UX Experience
Slow websites lose visitors quickly. If your pages take too long to load, people won’t wait. This negatively impacts your website performance metrics. It reduces your chances of generating sales.
That’s why page speed should be part of your website KPIs. Fast-loading pages help users stay longer and take action. One business improved its site by fixing the moving parts. This reduced the cumulative layout shift, and fewer people left right away.
Search engine visibility also depends on speed. Google ranks fast-loading websites higher. When your pages load fast and look good, visitors trust you more—and search engines do too.
Your conversion funnel analysis and UX data show how well speed and design work together. These KPIs help you identify and address areas for improvement. Now, let’s see how real-time tools let you track live changes and keep improving your results.
Use Real-Time Reports to Adjust for Ongoing Performance
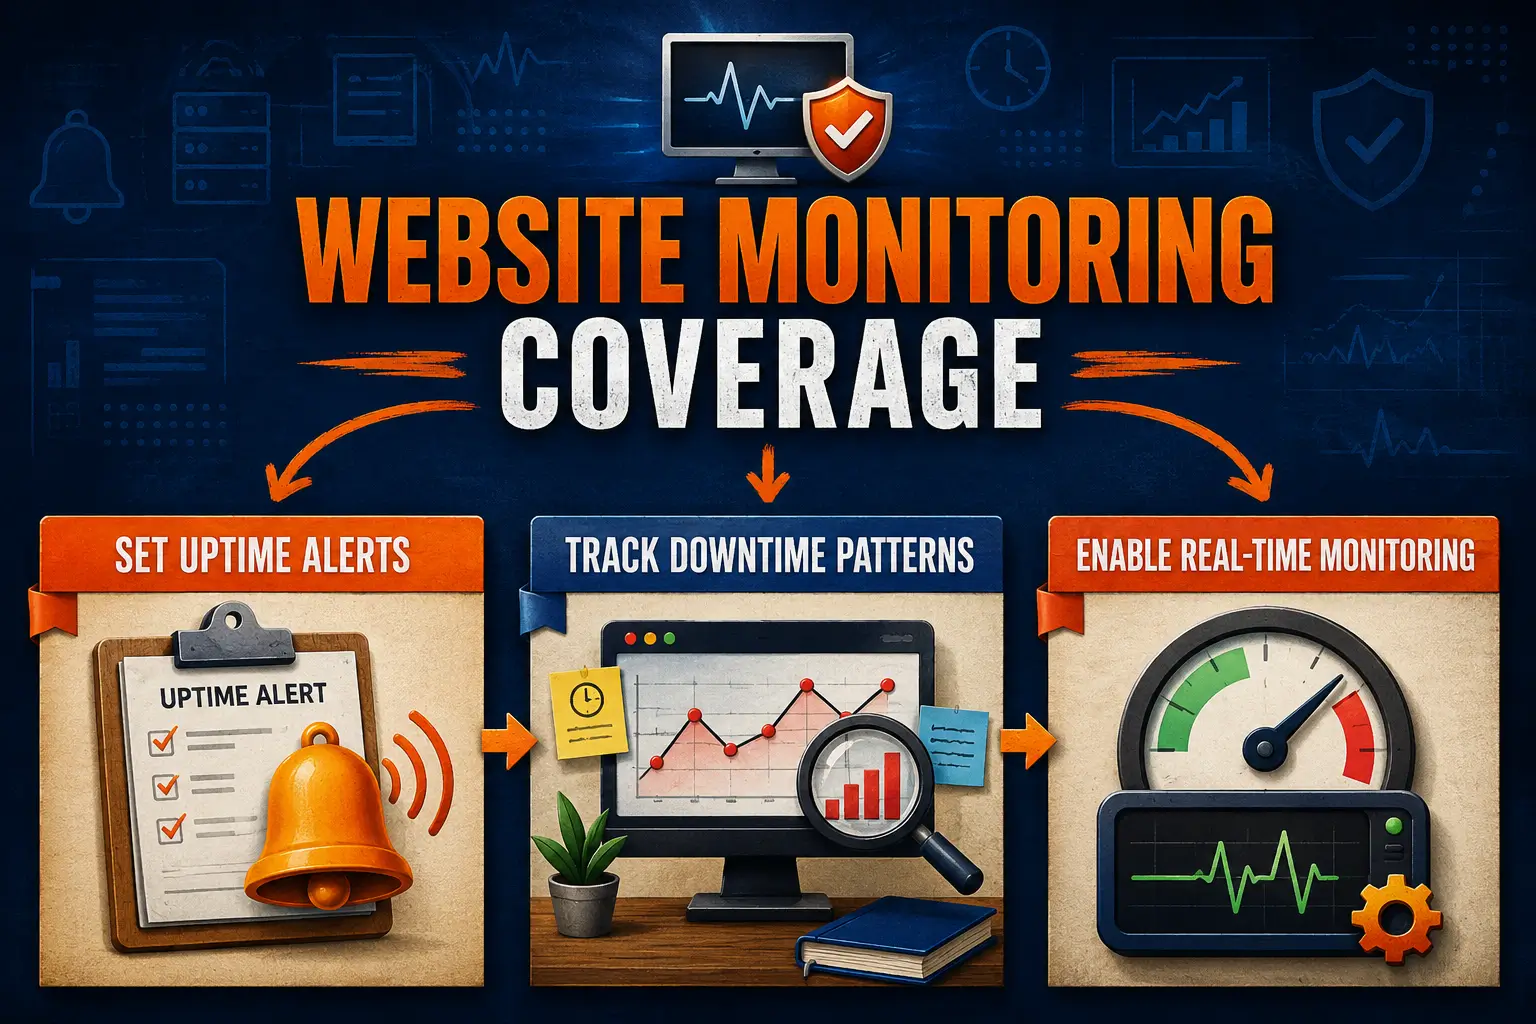
When your website is live, things can change fast. Real-time dashboards help you stay on top of what’s happening. You can track your website performance metrics as users move through your site.
Tools like Google Looker Studio show live data. You can see what’s working and what’s not right away. If a page drops in leads or load time, you can act fast. This makes it easier to manage lead generation metrics and user activity.
Using real-time tools with your website KPIs means faster updates. You don’t wait days to spot problems; you fix them now, before they grow into bigger issues in the future.
These dashboards also show how your changes affect core web vitals SEO. No matter what you’re tweaking—be it a button, an image, or your layout—these tools reveal how people respond to it.
Frequently Asked Questions
How do user engagement metrics reveal poor website design?
Engagement metrics reveal which parts of your site are effective and which are not. If people leave quickly or don’t scroll, it means your site design needs fixing.
Why does search engine visibility depend on performance scores?
Google wants sites that are fast and easy to use. If your site loads slowly or is hard to use, your performance score drops—and so does your search visibility.
What tools help track average session duration effectively?
Tools like Google Analytics show how long people stay on your site. Those tools help you learn what users like and when/where they lose interest.
How does Time to Interactive affect bounce rate?
A site that takes too long to work will definitely make visitors leave fast. A prolonged interactive time can cause frustration and increase your bounce rate.
What is the role of cumulative layout shift in user trust?
When pages shift while loading, people can’t click what they want. This layout shift appears disorganized and can cause visitors to lose trust in your site.
How can I better improve my core web vitals SEO using metrics?
Check your site speed, layout, and load time using the right tools. Fixing these core web vitals issues helps you rank better and keep users happy.
Conclusion
Staying on top of your website performance metrics helps you catch issues before they grow. They offer a clear view of how visitors use your site, where they drop off, and how they move from page to page. Acting on these insights gives you better overall results.
By using tools like conversion funnel analysis, you can better guide visitors. Minor fixes based on precise data can make a big difference. Use the right numbers to make your website stronger every day.
Track Website Performance Metrics Now
At The Strategic Tech, we utilize website performance metrics to identify hidden gaps and enhance your site’s results. From speed checks to lead generation metrics, we’ll measure, fix, and optimize your site step by step. Let us help you turn data into growth today. Get Your Site Performance Checked Today!